Dynamics in Ecological Systems
We develop data, modelling frameworks, and computational tools to address current limitations in global knowledge of biodiversity and ecosystem dynamics.
We have developed a global gridded data cube of annual maps of ecosystem areas by combining hundreds of terabytes of environmental datasets derived with petabytes of satellite imagery. These maps offer sufficient spatial and thematic detail for biodiversity and ecosystem services applications, such as ecosystem accounting and threat assessment. The ecosystem maps are conformant with the class scheme of the Red List of Threatened Species assessment developed by The International Union for Conservation of Nature (IUCN), assuring its interoperability with ongoing assessments of the status of thousands of species that rely on these ecosystems as habitat. Using our data, we can track ecosystem changes and conversions, such as seen in below.
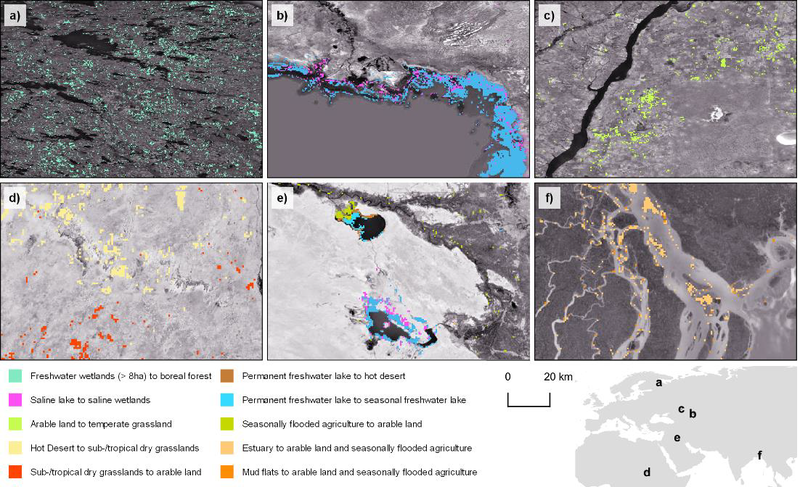
The map shows us examples of ecosystem changes between 1992 and 2018. a) In the Finno-Russian border region, freshwater wetlands receded under advancing Boreal forests. b) Along the Caspian Sea shore, receding waters became seasonal and allowed new saline and brackish marshes and pools to develop. c) In South Russia, croplands turned into temperate grasslands following land abandonment. d) In the East African Sahel, grasslands advanced north over the Sahara Desert, while receding further South under expanding agriculture. e) In Iraq, large portions of freshwater reservoirs and surrounding irrigated agricultural lands became seasonal or dried up as upstream water flow in the Tigris-Euphrates Basin was compromised by dam development. f) In Bangladesh, land reclamation led to the expansion of agriculture at the cost of coastal ecosystems (Meyer and Remelgado, in revision).
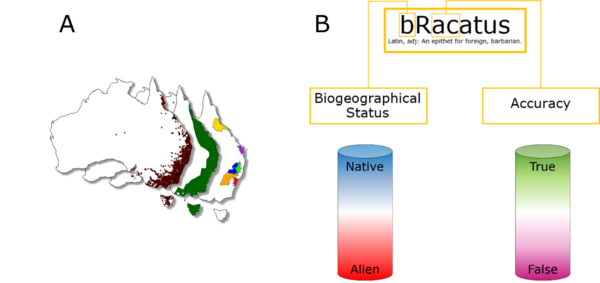
Our ecosystem-mapping work supports various research efforts, for example, helping us better understand the spatial distribution of invasive species. Here, we detected and quantified biases, gaps, and uncertainties in different data sources and developed general protocols to aid in the interpretation and use of species distribution data by scientists, resource managers, and policy-makers. bRacatus is a primize example of such work, providing tools for the automated assessment of accuracy and geographical status of georeferenced biological data.