sDiv – Synthesis Centre of iDiv
sDiv is the Synthesis Centre for Biodiversity Sciences, embedded in the active research environment of iDiv. It is an incubator for new ideas – a think tank and place of inherent horizon scanning. Scientific synthesis integrates diverse knowledge to increase the generality and applicability of results and yield novel insights or explanations. It can bring together existing but disparate data, methods, theories, and tools in new and perhaps unexpected ways. Synthesis is a highly varied effort, and its definition will change depending upon the lens of those who undertake it. Synthesis is a means for accelerating scientific understanding that is applicable across multiple places and scales. In biodiversity research, scientific synthesis is what makes it possible to find patterns, answers and solutions to some of the major questions facing science and society.
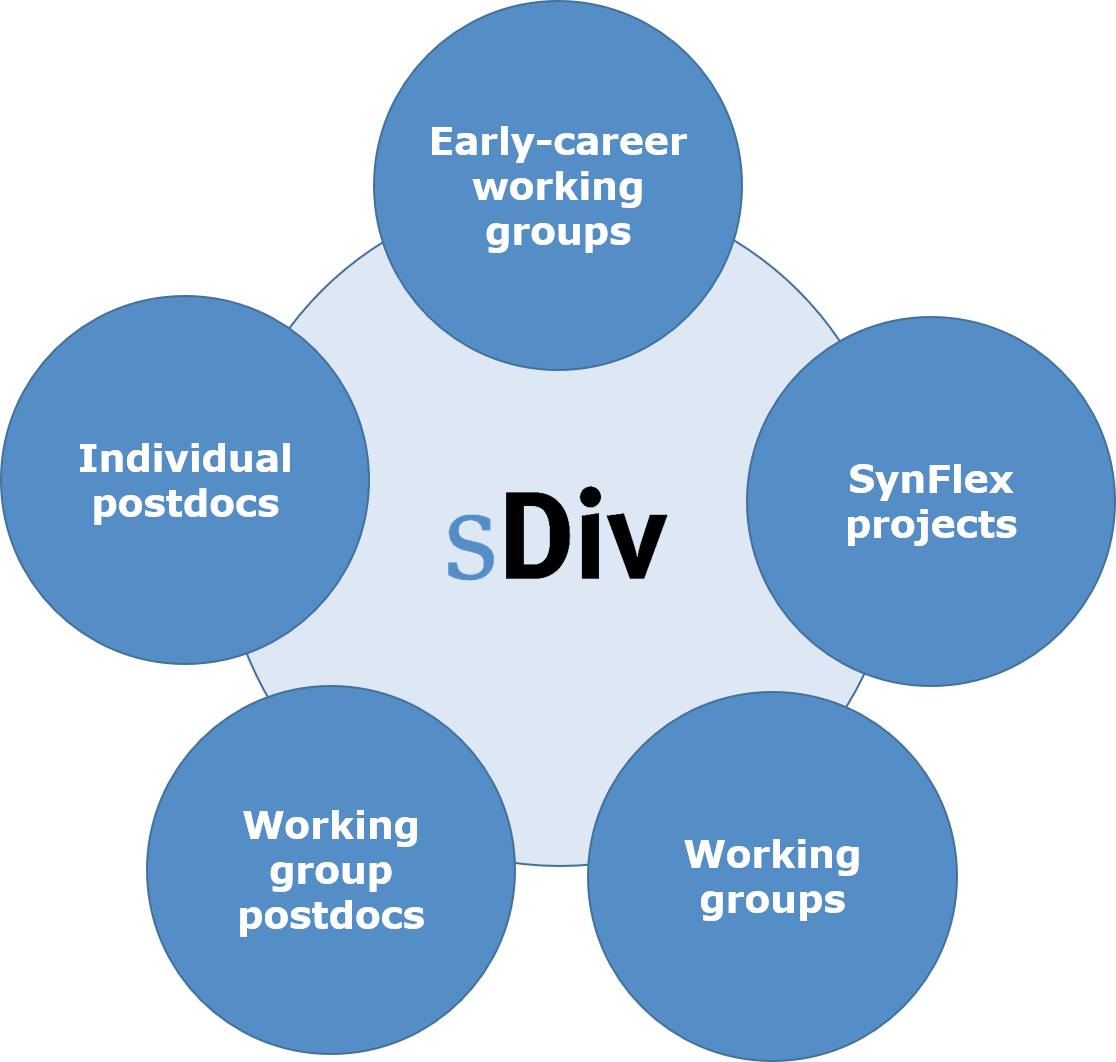
The sDiv synthesis centre comprises three different and central instruments: meetings of international working groups (standard format; groups driven by early career researchers), projects with flexible combinations of research approaches (beyond working groups) and synthesis projects carried out by sDiv postdocs. It provides an opportunity to work without distractions and scope intensively for collaboration and idea-sharing to identify solutions to society’s most challenging and complex environmental problems over several years.


sDiv people
All sDiv people
Postal address
German Centre for Integrative Biodiversity Research (iDiv) Halle-Jena-Leipzig
Puschstrasse 4
04103 Leipzig
Germany
Head of sDiv
Dr Marten Winter
Phone: +49 341 97 33129
Administrative Assistant
Carolin Kögler
Phone: +49 341 9733157
If you have any questions about sDiv, do not hesitate to contact us!