sPlot Database
Implementation
Since the sPlot Meeting I, people involved with sPlot started compiling a common global vegetation-plot database covering all biomes of the Earth that can be combined with the existing global trait database TRY. At the sPlot Meeting II in December 2014, the first version of the sPlot database (sPlot 1.0) was released for testing purposes and planning of research papers under the coordination of Jürgen Dengler. Since then, the content has been extended and improved enormously. In February 2016 finally sPlot 2.0, the first release for scientific studies, was published with more than 1.1 million geo- referenced plots from all seven continents and 130 countries. Since then, sPlot was further expanded under the coordination of Borja Jiménez-Alfaro first, and Francesco Maria Sabatini then. In August 2020, sPlot 3.0 was released, which further expanded version 2.0 and included almost 2 million plots providing a better coverage of South America, Asia and Australia. sPlot 4.0 was released in September 2023 and its updated version sPlot 4.1 in September 2025. It contains 2.5 million plots and incorporates time-series data. This version of the datasets expands its coverage mostly in Southeast Asia, Oceania, and North Southwest Africa.
The unique characteristic of sPlot of combining fine spatial grain with maximum spatial extent has been opening new analytical options for community ecologists and macroecologists. Please check our list of publications.
sPlot releases
sPlot 4.1, release in September 2025, updates sPlot 4.0 with more detailed information for environmental variables and improved taxonomic harmonization.
sPlot 4.0, release in September 2023, with 2,547,857 plots (all georeferenced with varying precision) with 287,768 observations of resampled plots from 308 databases, from 144 countries and seven continents.
sPlot 3.0, release in August 2020, with 1,978,686 plots (1,976,235 georeferenced with varying precision) from 161 databases, from 140 countries and seven continents. For additional info, see Newsletter 9.
sPlot 2.1, release in October 2016, with 1,121,244 plots (all geo-referenced with varying precision) from 110 databases, 130 countries and all seven continents. This is an improved version of sPlot 2.0. For a full description see Bruelheide et al. 2019 – JVS.
sPlot 2.0 (full version), release 0n 21 January 2016: 1,115,705 plots (all geo-referenced with varying precision) from 110 databases, 130 countries and all seven continents, with intersection to the gap-imputed trait data of TRY 3.0. For further details see Newsletter 5.
sPlot 1.0 (full version for test purposes), 20 November 2014: 840,000 plots (700,000 geo-referenced) with intersection to the trait data of TRY 2.0.
sPlot 0.9 (prototype), 19 August 2014: more than 550,000 vegetation plots from 56 databases and 52 countries.
sPlot content
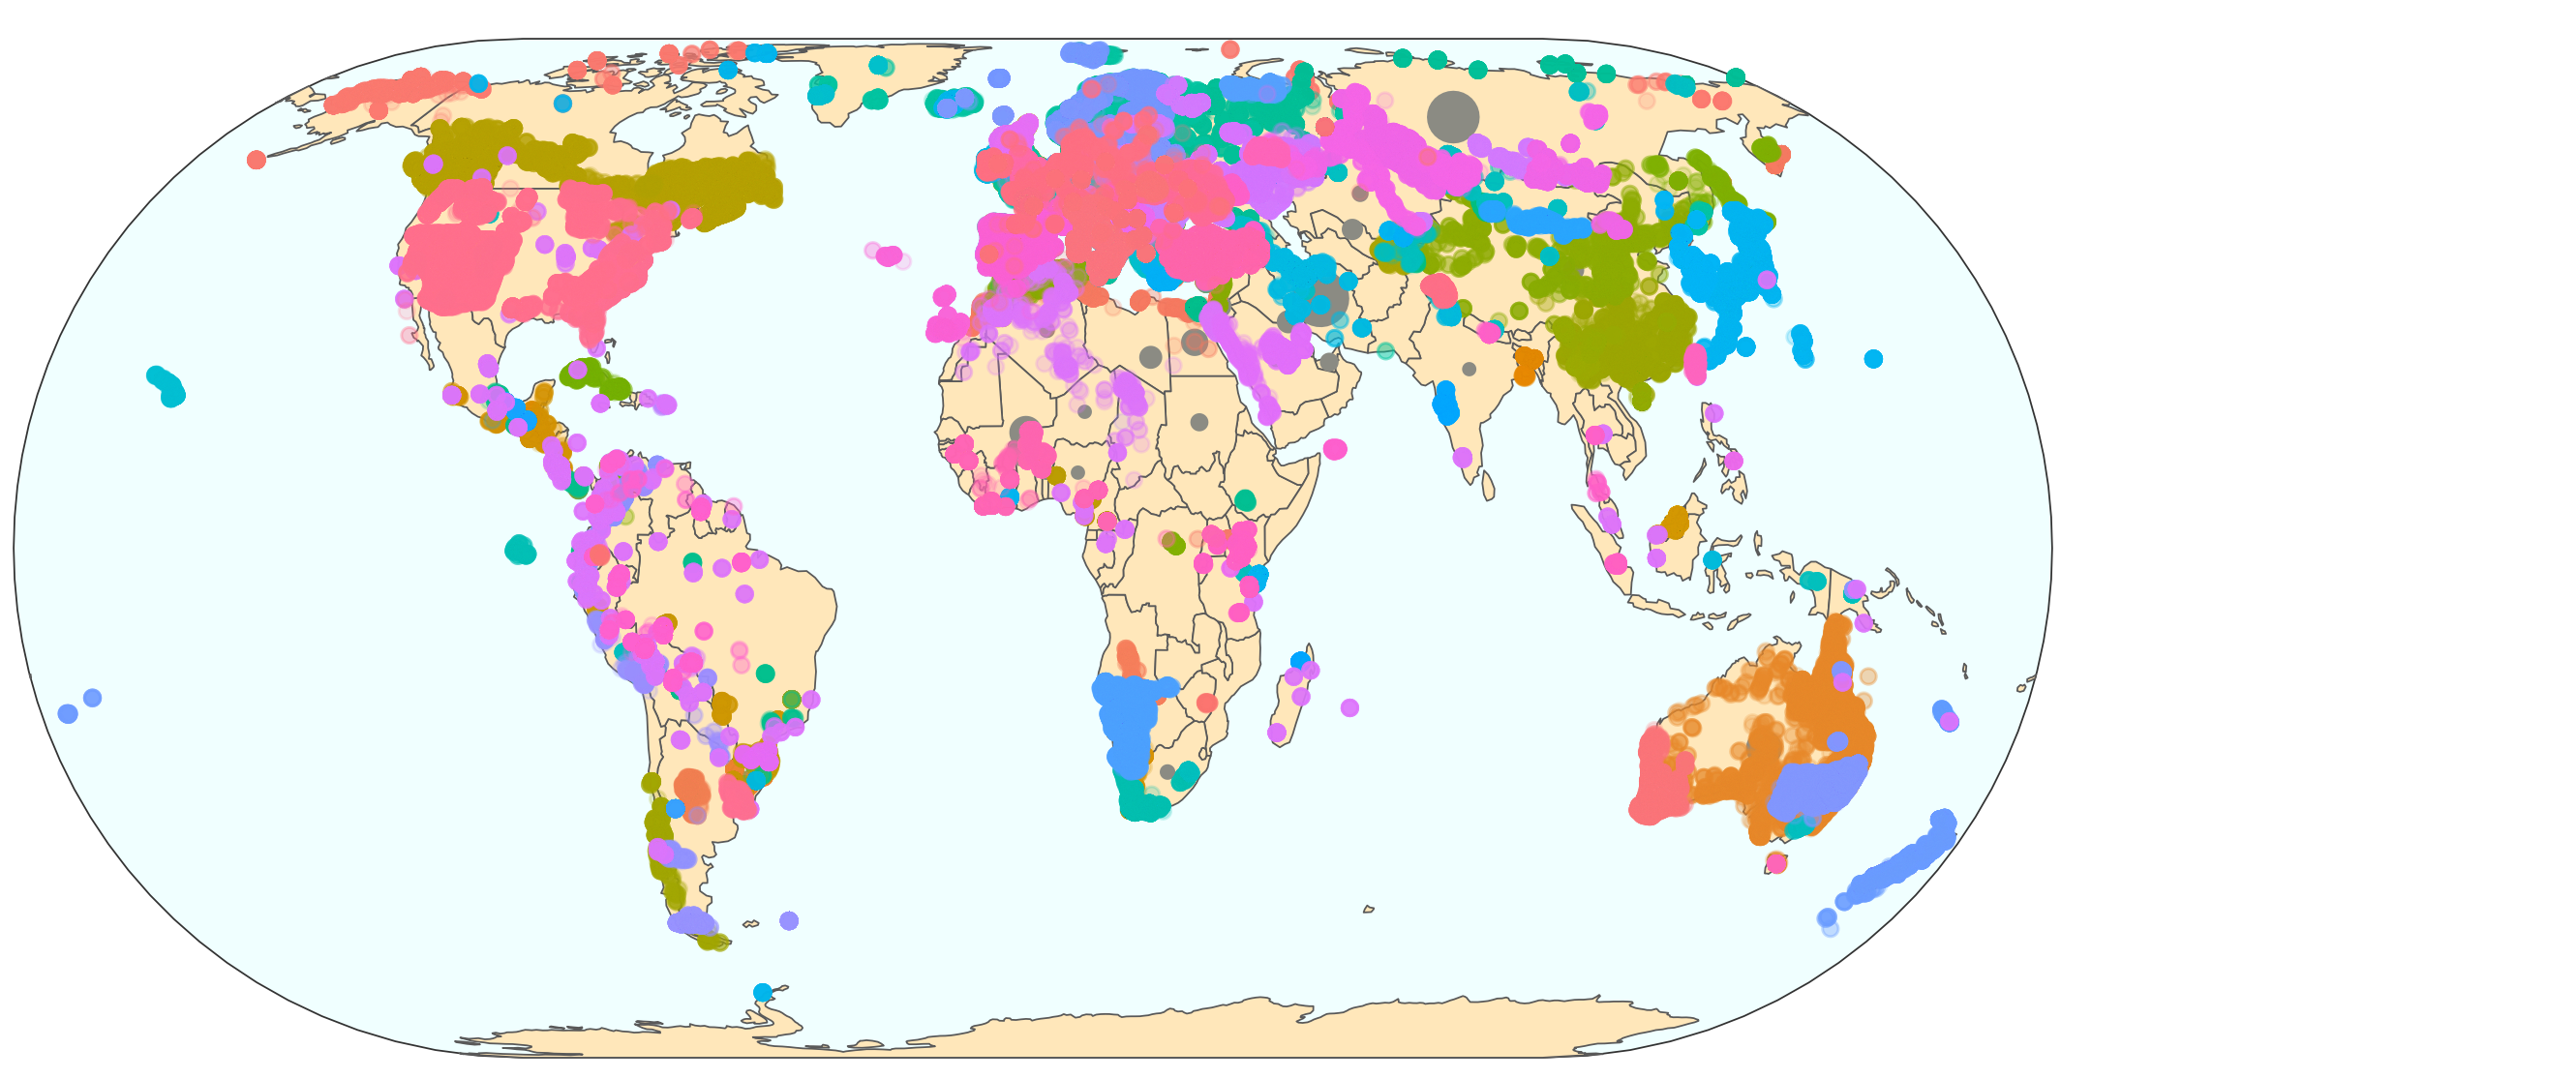
Distribution of plots in sPlot 4.0. Different colors represent different contributing databases.
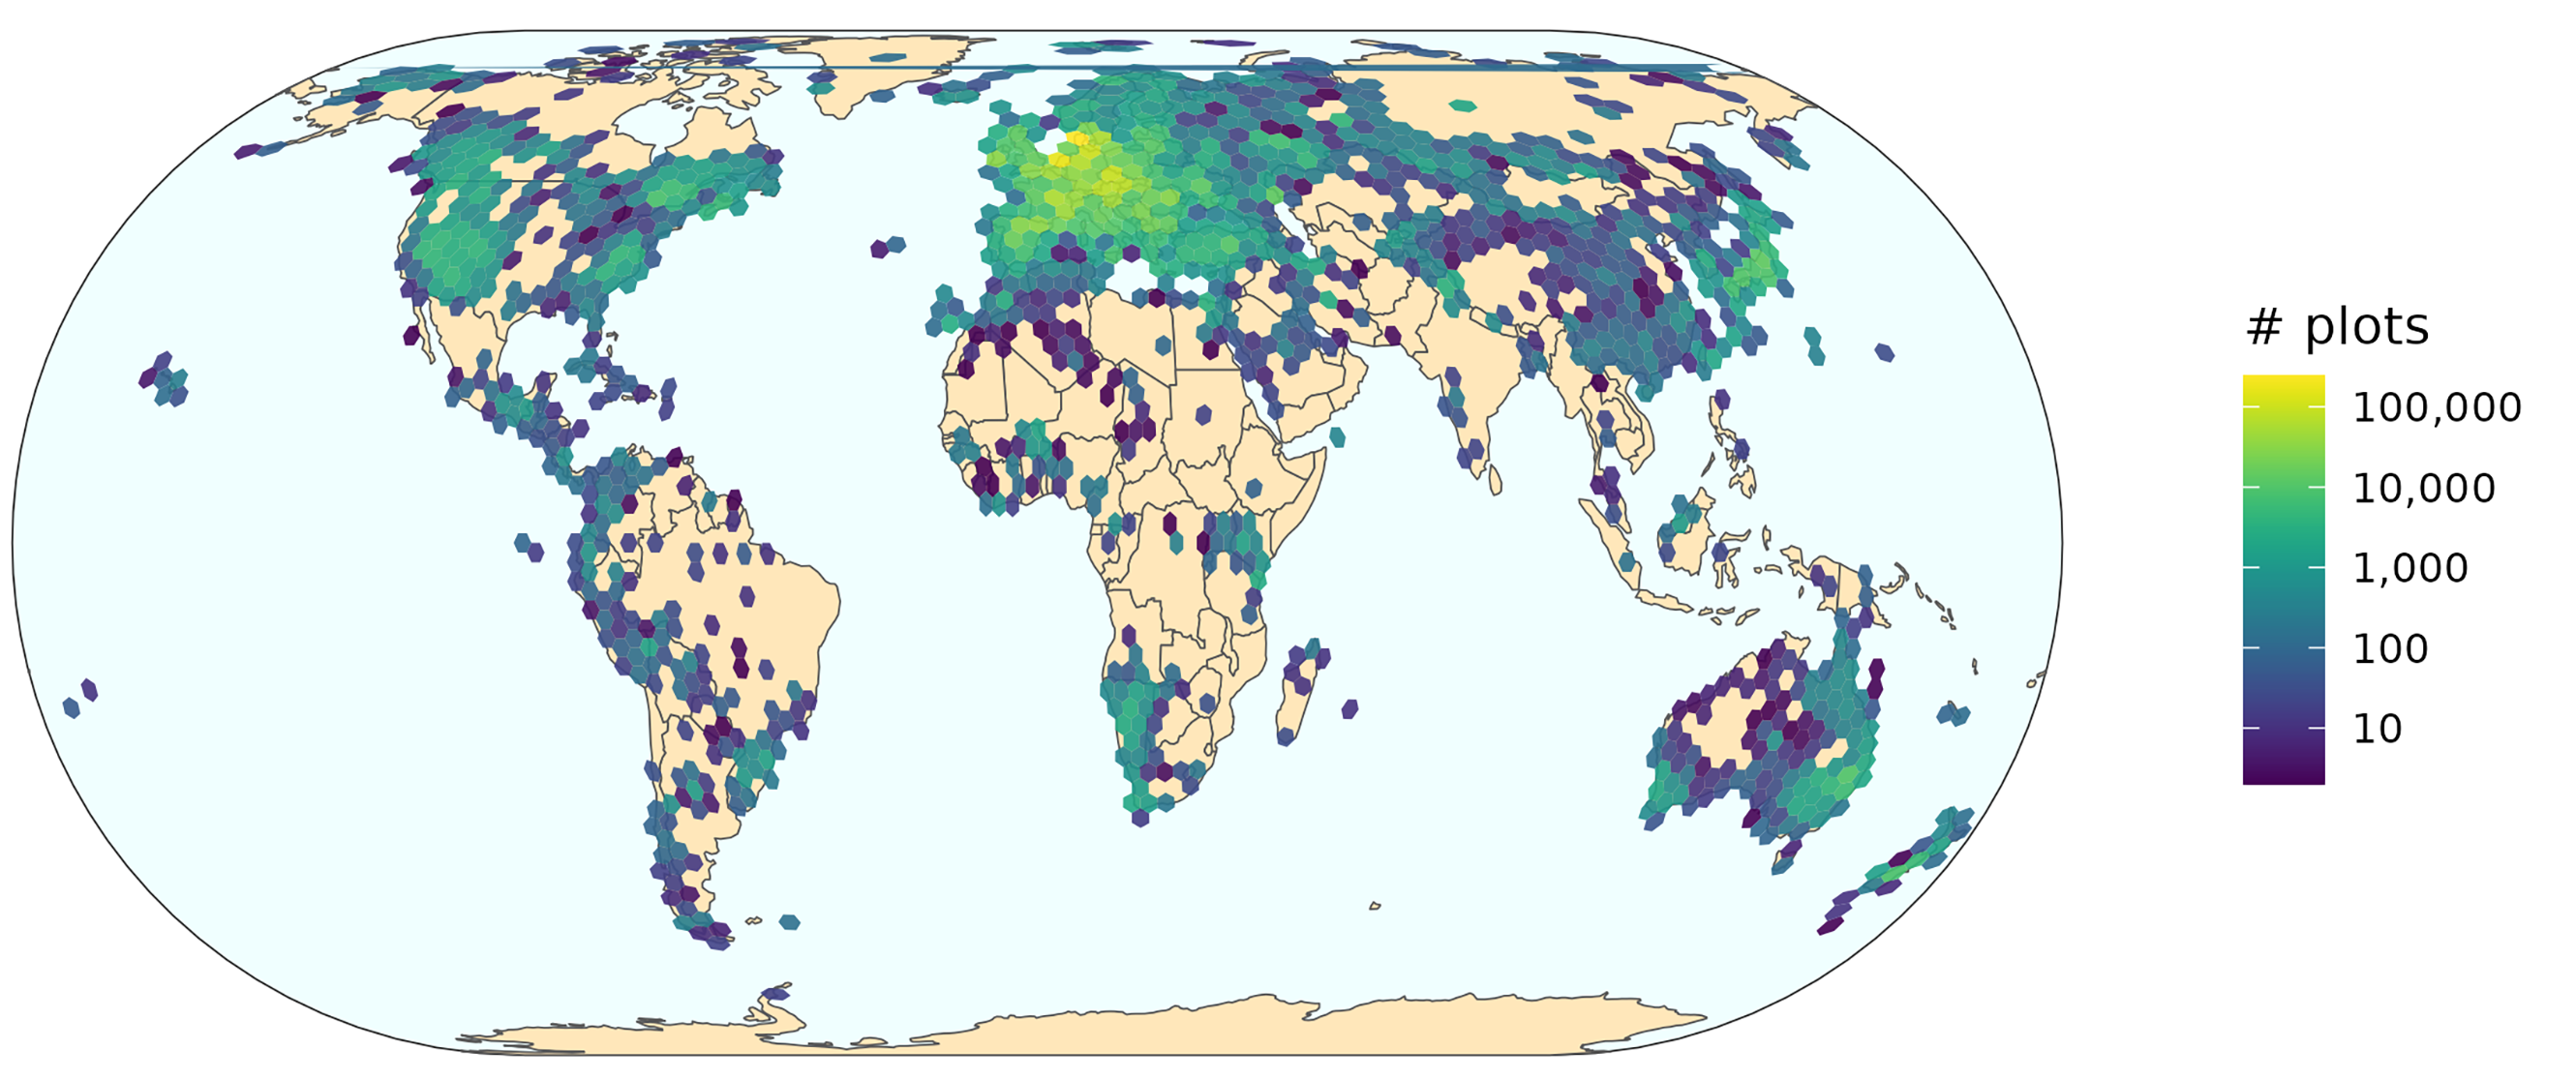
Density of vegetation relevés (point and time-series data).